Create a Content Performance Dashboard with Lovable AI: A Guide to Data-Driven Content Strategy
In the world of content marketing, having an analytics dashboard as a versatile tool for evaluating and tracking various metrics related to content performance is key to success. Lovable AI is changing how organisations build and maintain content performance dashboards by giving control back to marketing teams.
No-Code Dashboard Revolution
The traditional way of building performance dashboards meant relying on dev teams or settling for off-the-shelf solutions that were inflexible. Lovable AI is changing that by democratising dashboard creation while keeping professional quality and customisation options.
Marketing Teams
Lovable AI removes the technical barriers that previously separated marketing teams from their data:
-
Intuitive dashboard creation interface
-
Drag-and-drop metric configuration
-
Custom visualisation options
-
Flexible layout designs
Marketing teams can now create what they need, when they need it. They can also create a content marketing dashboard to measure the impact of their efforts and demonstrate ROI.
Code Ownership and Flexibility
Unlike many platform solutions Lovable AI offers:
-
Full code ownership
-
Export capabilities
-
Customisation freedom
-
No vendor lock-in
This means long term flexibility and scalability for your dashboards.
Setting Up a Content Performance Dashboard
Setting up a content performance dashboard is crucial for tracking the success of your content marketing efforts. A well-designed dashboard provides a clear view of your content’s performance, helping you identify trends and make data-driven decisions. To set up a content performance dashboard, start by defining your content marketing goals and objectives. This will guide you in identifying the key metrics that align with your goals, such as engagement rates, conversion rates, and customer acquisition costs.
Next, choose a dashboard tool that integrates seamlessly with your content management system and analytics platform, such as Google Analytics. This integration ensures that you have access to accurate data and real-time updates. Customize your dashboard to display the most relevant metrics and KPIs, and set up regular reporting to track your progress. By doing so, you can continuously monitor your content marketing efforts and make informed decisions to optimize your strategy.
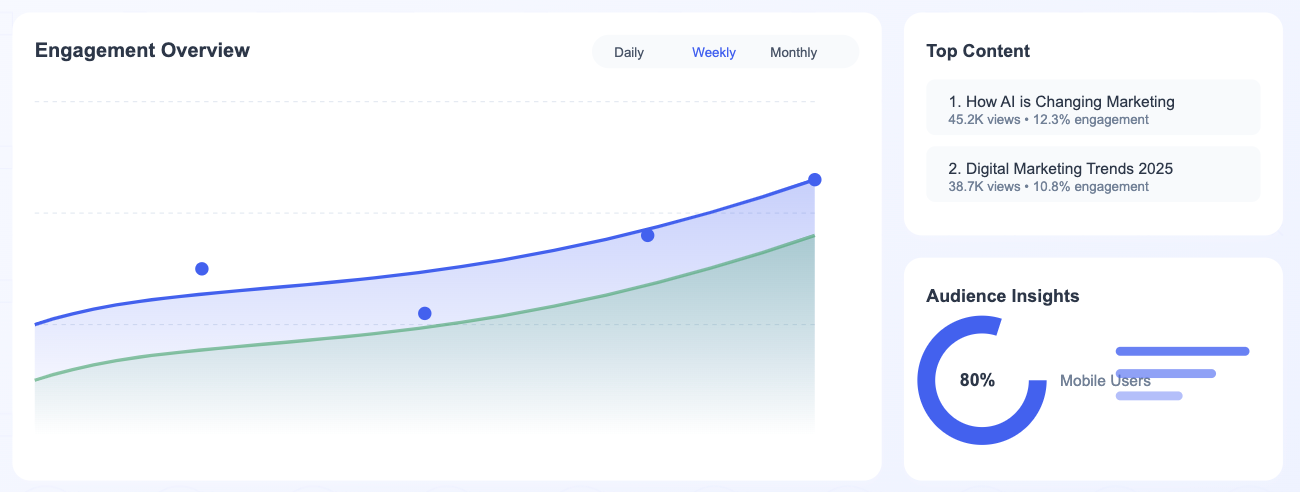
Dashboard Features
Live Real Time Data
Monitor your content in real-time:
-
Live engagement metrics
-
Instant performance updates
-
Real-time audience behaviour
-
Trend identification
-
Real-time customer engagement analysis
Custom Metrics
Define and track what matters most:
-
Key performance indicators (KPIs) that align with your business objectives
-
Page views and unique visitors
-
Time on page and bounce rates
-
Social sharing metrics
-
Conversion tracking
-
Custom goal completion
Collaboration
Team involvement in dashboard creation:
-
Shared access controls
-
Team comments
-
Version history
-
Role based permissions
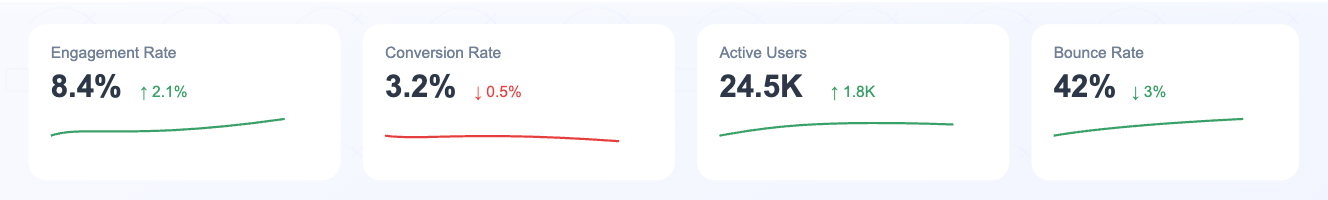
Key Metrics for Content Performance
When it comes to measuring content performance, there are several key metrics to track. These include:
-
Engagement Rates: This metric measures the number of likes, shares, and comments on your content. High engagement rates indicate that your content resonates with your audience and encourages interaction.
-
Conversion Rates: This metric measures the number of leads or sales generated from your content. Tracking conversion rates helps you understand the effectiveness of your content in driving desired actions.
-
Customer Acquisition Cost (CAC): This metric measures the cost of acquiring a new customer through your content. Lower CAC indicates more efficient marketing efforts.
-
Customer Lifetime Value (CLV): This metric measures the total value of a customer over their lifetime. Understanding CLV helps you focus on retaining high-value customers.
-
Return on Investment (ROI): This metric measures the return on investment of your content marketing efforts. High ROI indicates that your content strategy is delivering value.
By tracking these metrics, you can gain valuable insights into the performance of your content and make data-driven decisions to optimize your content marketing strategy.
Using AI to Enhance Content Performance
Artificial intelligence (AI) can be a powerful tool for enhancing content performance. AI-powered analytics tools can help you identify trends and patterns in your content data, providing actionable insights to improve your content marketing strategy. For instance, AI can analyze audience behavior to determine which types of content are most engaging, allowing you to tailor your content accordingly.
AI can also help you personalize your content for different audience segments, optimizing engagement and conversion rates. Additionally, AI-powered content generation tools can help you create high-quality content at scale, reducing the time and effort required to produce content. By leveraging AI, you can enhance your content performance and stay ahead of the competition.
Examples
Monitor campaign performance:
Leverage the analytics dashboard to monitor the performance of various marketing campaigns. Track channel performance, content engagement rates, conversion paths, ROI, and A/B testing results.
Content Optimisation
Make data driven decisions about content:
-
Top content identification
-
Content gap analysis
-
Audience preference
-
Format performance
-
Distribution channel performance
Executive Reporting
Provide insights for leadership:
-
High level metrics
-
Strategic goals
-
Resource allocation
-
Competitive benchmarking
-
ROI
Actionable Insights for Marketing Efforts
A well-designed content performance dashboard provides actionable insights that can inform your marketing efforts. By tracking key metrics and KPIs, you can gain a deeper understanding of your audience’s behavior and preferences, and make data-driven decisions to optimize your content marketing strategy.
For example, if your dashboard shows that a particular type of content is performing well, you can create more content like that to capitalize on the trend. Similarly, if your dashboard shows that a particular audience segment is not engaging with your content, you can adjust your targeting and personalization strategy to better reach that segment. These actionable insights enable you to refine your marketing efforts and achieve better results.
How To
Dashboard Design Rules
Follow these guidelines to create a dashboard:
-
Focus on key metrics
-
Keep it simple
-
Mobile friendly
-
Contextual
-
Easy to navigate
Data Strategy
Get more out of your dashboard by:
-
Multiple data source integration
-
Automated data updates
-
Data validation
-
Historical data
-
Cross-channel analysis
-
Automated data collection processes to reduce human errors and manual labor
Performance
Keep your dashboard running smoothly:
-
Regular data cleaning
-
Performance monitoring
-
Caching
-
Query optimisation
-
Regular updates
Integrations
Tool Integrations
Lovable AI integrates with:
-
GitHub for version control
-
Supabase for database management
-
Analytics platforms
-
CMS systems
-
Marketing automation tools
-
Marketing agencies to integrate AI solutions and utilize data analytics for better reporting and efficiency
Custom API
Add more with:
-
Custom API integration
-
Webhooks
-
Third party service connections
-
Data exports
-
Automated workflows
How To Measure
Key Performance Indicators (KPIs)
Track what matters most:
-
Content engagement
-
Conversion metrics
-
Audience growth
-
Revenue attribution
-
ROI
-
Transparent and efficient reporting process: Emphasize the importance of open communication and data security in reporting. Automated tools can help mitigate manual errors and enhance the reliability of reports.
Analytics
Turn data into insights:
-
Trend analysis
-
Predictive analytics
-
Audience segmentation
-
Content forecasting
-
Attribution
Get Started with Your Dashboard
Setup
- Define your objectives
-
Identify your key metrics
-
Set your measurement goals
-
How often will you update
-
Define data sources
- Design
-
Choose visualisations
-
Organise metrics
-
Add filters
-
Plan for growth
- Build
-
Set up data connections
-
Automate updates
-
Test
-
Train team
Future Proofing
Scalability
Plan for growth by:
-
Increased data volume
-
More metrics
-
More data sources
-
More functionality
-
More team members
Continuous Improvement
Keep your dashboard running smoothly by:
-
User feedback
-
Performance optimisation
-
Feature updates
-
Data quality
-
Process refinement
Building a content performance dashboard with Lovable AI is a game changer for how you measure and optimise your content. No code, powerful features and full code ownership makes it perfect for teams who want to own their content analytics.
Whether you’re a small marketing team looking for better insights or a large organisation looking to simplify content performance tracking, Lovable AI has the tools and flexibility to build what you need to drive your content strategy.
Get started now. Build your dashboard. See for yourself. 😊
Let's Talk
Your ride-or-die partner
Your own world-class product team at a fraction of the cost
Tell us about yourself
- From Idea to Product 10X Faster
- Unlimited Request & Revisions
- Streamlined Tooling
- Your Dedicated Team